Summary
I really enjoy rewatching games during the offseason, so I set up an index that helps to choose which game to rewatch without knowing anything else than the teams and the day. Using R, I arranged an algorithm that takes account of changes in win probability during the game to make it possible to bring out exciting games to watch.
The code takes also account of good pitching, no-hitter situations, walk-offs, and rivalry, to get a mix of different kinds of interesting games. BWRI is a percent rank, so 1 is the most exciting game detected by the algorithm and 0 the worst. BWRI includes seasons from 2011 to 2020. You can dig on BWRI in list mode if you want, but my suggestion is to use the random mode, filtering for games with a score > 0.95, which is basically as if you get the best game for a random day of the season. BWRI doesn’t take account of season context, you can choose just postseason games to be shown though.
Extended version
Offseasons are too long. I’m not much into the hot stove thing, so usually, I spend time watching games from the past season, eager to discover relievers or just having fun with exciting games. It’s not half the fun if you know in advance the outcome of the game, but this is not hard since there are more than 2,400 games in an MLB normal regular season. Sometimes I watch random games, but then I found baseballrewatch.com, and that saved me during the spring lockdown. Unfortunately, the website hasn’t been updated for the 2020 season.
It was then that I thought if it would be possible to make an index to evaluate how much a game is worth to rewatch, just using the play by play stats of the game. Using Retrosheet data and the knowledge of ‘Exploring Baseball Data with R‘ I could easily get ready the basic tool to calculate the index: Win Probability Added (WPA) play by play, which is how the probability to win a game changes play after play. That’s the main tool used to create what I call Baseball Worth Rewatch Index (BWRI), there are other things I took into account though.
Total WPA
The first I thought was, If I add the absolute WPA values of every play in a game, the highest figures will point me to exciting games. Games that switched from the hands of one team to the other several times during the game. Drama, leverage situations, and entertainment, especially in the late innings, when a change in the scoreboard cashes a higher value of WPA. So the first factor of BWRI is Total WPA, nevertheless, I made some adjustments to it.
The main problem was the “noise” produced by non-important plays. In close games, those could make a huge difference at the end. A boring game decided at the 8th got too much score, so I decided to use just the plays that changed the probability of winning 8% or more.
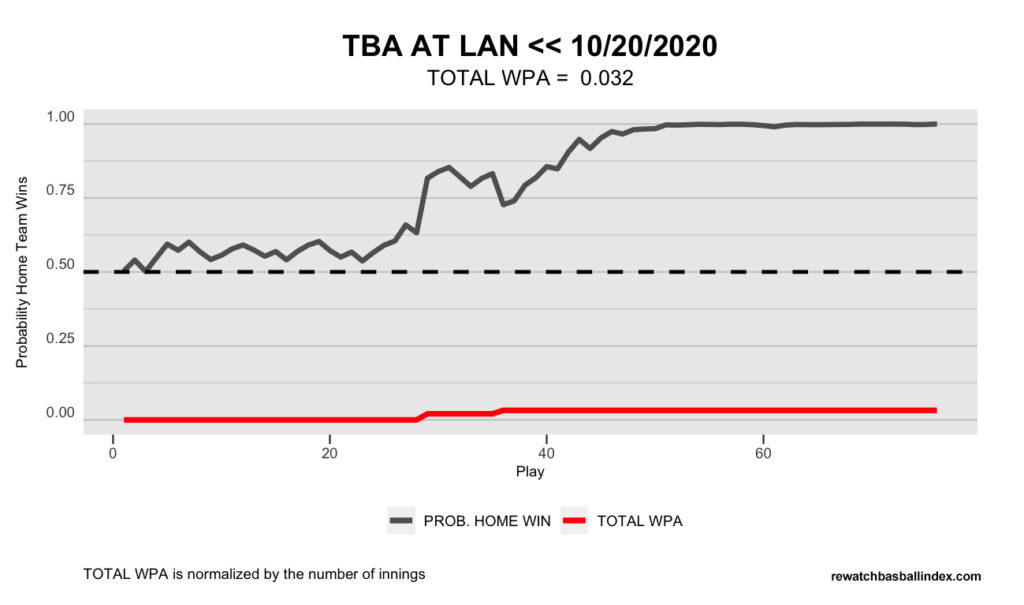
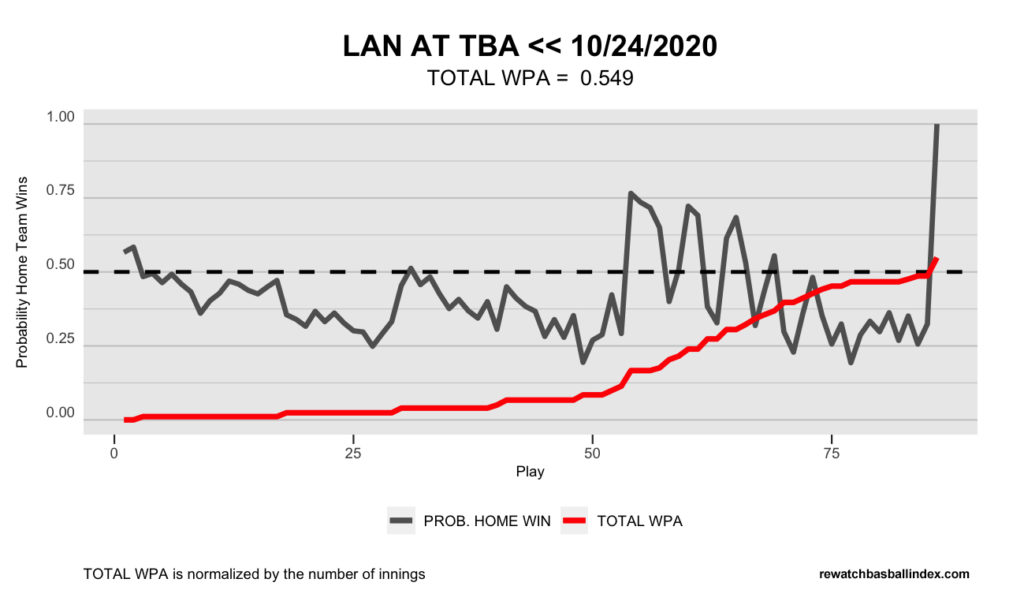
Two recent examples of Total WPA from the last World Series. Game 1, Dodgers score 2 runs in the 4th and 4 more in the 5th, so the game gets a low Total WPA. On the other hand, game 4 gets the highest play-off Total WPA value from the last 10 years.


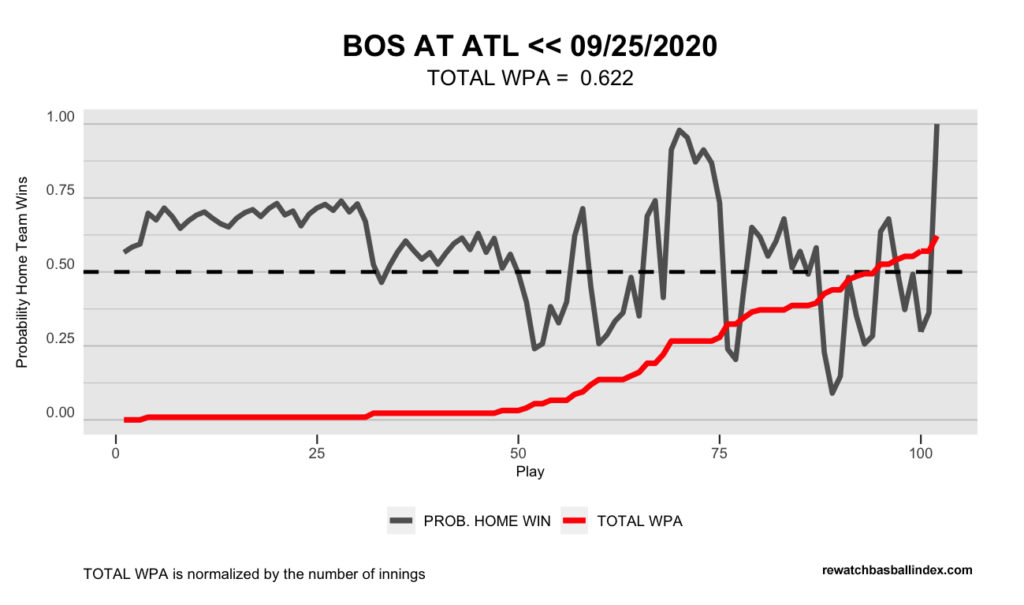
And as a curiosity, here you have the game with the most added WPA since 2011. It’s very recent, late in the 2020 season Atlanta wins Boston with two extra innings. Takes the lead with 3 runs at the eight, Boston ties the game with 2 runs in the ninth, each team scores two runs in the tenth, Boston adds one more in the eleventh, but Atlanta finally wins with two more and a walkoff. Wow. And nobody in the stands.

Unexpected outcome (UO)
It’s great when the team that has been losing most of the time wins at the end. I love that kind of games, and usually those have low added WPA, because during most part of the game the in the end winning team is trailing by a 2 or more run margin. In the beginning I though that would be as easy as average the probability of winning, and subtract it from the final outcome. That turned out to fall short considering my purpose, so I decided to flag winning probability from seventh inning to the end, and in last two extrainnings, to detect late changes. The final OU is a summation of all that.
Pitching
It’s not all about runs and action, good pitching games are really enjoyable. Pitching here is evaluated in two simple ways. First of all how many Ks per inning there is in a game, and how close it is to a no-hitter. So from games that get to the 7th with a no hitter to no-hitter games, all of those get extra points. Would be really nice to take account of low probability catches too, unfortunately, I think this data is not available on a game basis.
Close games (CG)
As we love UO, it’s also nice when the game is very balanced and matched. In that case, got the difference between the win probability and 0.5 in every plays, and summate all of them. Low values mean close games. I thought of it as a main factor in the beginning, but then decided to keep it low, since it spoiled the BWRI score of some exciting games.
Walkoff
There’s extra points too for a walk-off game, most of them already grade high on the main indicators, but that extra push helps to highlight happy endings for home teams.
Rivalry
Finally, I added some extra points for games with rivalry, for that purpose I use data from knowrivalry.com.
Good defensive plays
For seasons 2022 and on, I added a new feature to the mix. Using Statcast information about catch probability, games with outfield catches with low probability (< 0.5) get an extra push on the score.
Other features
I decided to grade Added WPA and UO on a Z score, so very unbalanced games not only make no addition but even subtract value on BWRI. On the other hand, assumed good pitching and all other factors should be just positive values and not decrease the final score. BWRI doesn’t take account of season context, you can choose just postseason games to be shown though, or filter by month.
If you’re asking which is the weight of every factor on the final BWRI score, the answer is that for the top 500 games, Added WPA weights about 33% of the score, Unexpected Outcome 32%, Ks factor 17%, close games 8%, walk-off 7%, rivalry is accountable for just slightly more than 2%, and no-hitter factor for slightly less than 2%.

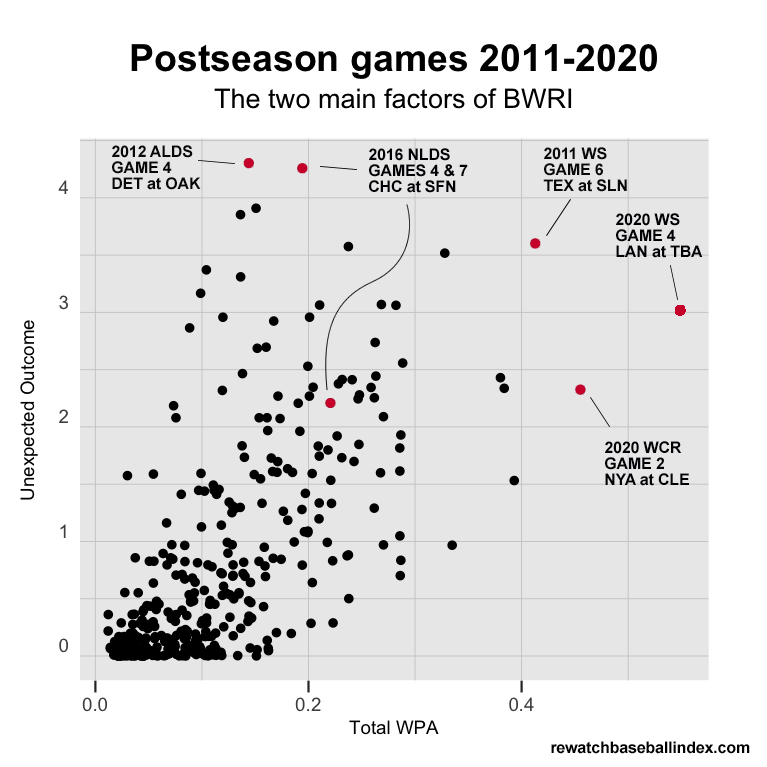
Here are the two main factors of BWRI, only with games from the last 10 postseasons. Notice that most of the games have some Added WPA, but many have no Unexpected Outcome rate. I’ve highlighted some of the games that get a high score. The most isolated dot is the wild end of 2020 World Series Game 4. 2011 Word Series Game 6 makes a difference too, you’ll probably remember the game if I tell you a name: David Freese. On the side of UO the most remarkable according to BWRI is the ninth-inning comeback of Oakland on game 4 of 2012 ALCS, just followed by the Cubs comeback on game 4 of 2016 NLDS. World Series Game 7 from 2016 gets a BWRI over 0.8 too, but rates second most exciting game of that Cubs road to the title.
To evaluate win probability play by play I used the method suggested by Max Marchi, Jim Albert and Benjami S. Baumer.
Thanks for reading. Sorry for my English. I hope you enjoy using BWRI and rewatching baseball. Don’t hesitate on leaving a comment or getting in touch for any comments or suggestions.
