Discussing the most exciting MLB games of 2024 season according to BWRI

Here come the days without live MLB games. The season is almost over, and it is time to recap and discuss the highest BWRI scores of the season. The most exciting games.
Entering 2024 I migrated the BWRI project from R and Retrosheet to Python and Savant. That allows me to get BWRI scores almost live.
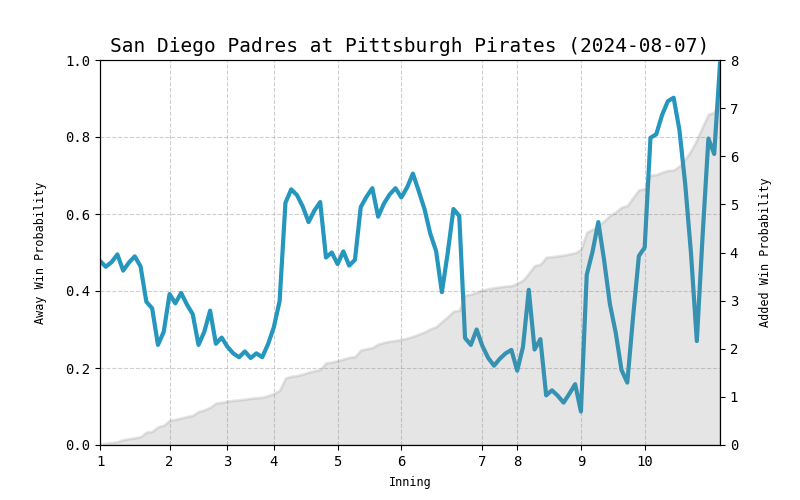
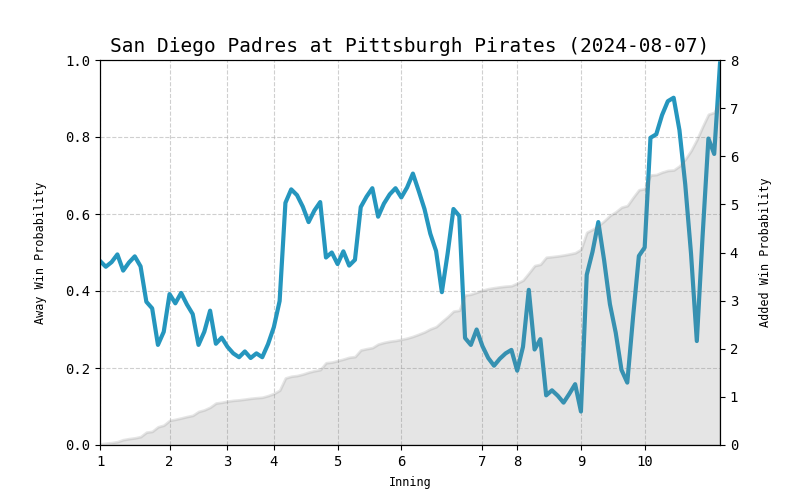
The most exciting game of the season according to BWRI it’s Padres at Pirates in August the 7th.
If you watch at the score, doesn’t seem to be that exciting, even though it’s the game with the most Win Probability Added. From 7th to 9th just one run that ties the game at the top of the 9th. San Diego scores three on the top of the 10th, and Pittsburgh’s rally in the bottom of the 10th falls short for just one run.

But sometimes it’s not the runs, it’s the traffic on the bases: in the top of the 8th, Pittsburgh filled 1st and 3rd with no outs, but couldn’t cash any runs. Bottom of the 8th 1st and 2nd with just one out, no runs. Bottom of the 9th based loaded with one out, but Pittsburgh couldn’t put it on the books. And finally, bottom of the 10th, with based loaded, a wild pitch gives Pittsburgh a run, and at this point, the Pirates have a 75% chance of winning the game.

So the game was really pure drama and really enjoyable, even though most of this scoring positions didn’t end up becoming runs. The graph speaks for itself. Look at those spikes, the gray area is the total added win probability.

A score of 87.2, the 11th highest score overall since 2016.

The second-highest score of the season is Blake Snell’s no-hitter. As I always mention, BWRI pays attention to no-hitter situations and ranks high those games, even though they usually lack of drama. The game rates that high also because there were 25 K in total, 11 from Snell, but also 14 from the Reds pitching crew. That made some difference. A score of 85.8

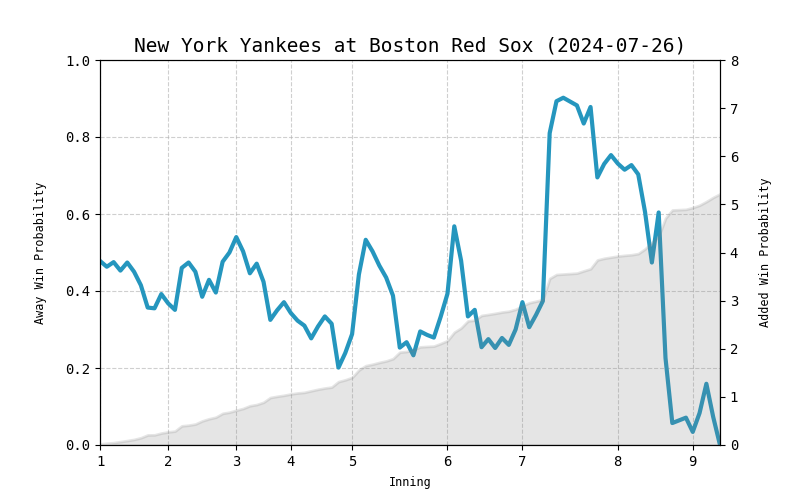
The third-highest score it’s a classic rivalry game: Yankees-Red Sox, July 26th. After a couple of home runs during the top of the 7th, Yankees took the lead, 7-4, opening a gap in a game that already had scattered runs and ups and downs until then. Red Sox scored two in the 7th and three in the 8th to rally and take the game.

It’s interesting to mention that the game is not even rated in the top 10 with the most added WPA for the season, but benefits from basically the most rivalry points a game can have, and also the score gets an extra push from a 4 stars outfield defensive play.

Here you have the 4 stars defensive play of the game, 50% catch probability according to Statcast. Does it deserve the 4 stars? I don’t know, but after paying attention to some of those 4 and 5 stars plays, some of them are not quite spectacular. Maybe the next year I will have to change how that factor weights on the final score, maybe smooth it with an average of all the defensive plays of the game would be better.

Postseason

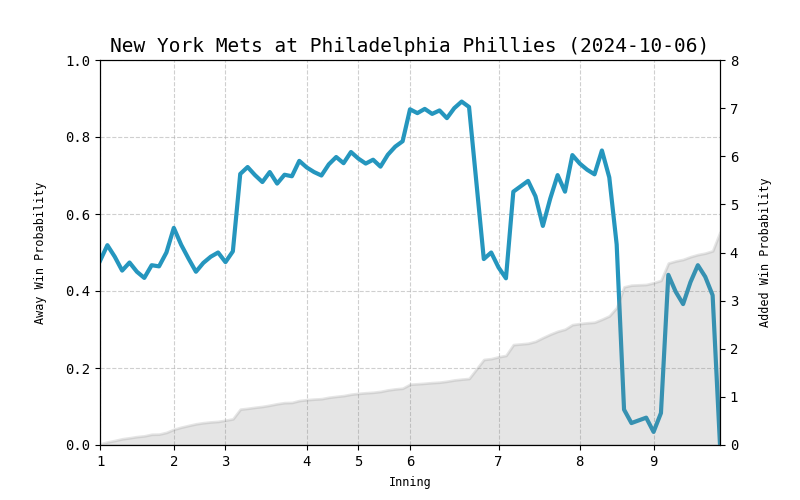
And what about the postseason? As you could predict, the most exciting game of the postseason had the Mets involved, but not in a win! It turned out to be the second game of the Division Series against the Phillies. Quite a rollercoaster.

Mets were on top during most of the game, but back to back homers from Castellanos and Harper in the 6th tied the game. Nimmo scored in the 7th, and Philly scored three in the 8th. The game seemed to be finished at that point, but Vientos homered in the 9th, what made think of another impossible Mets win. Finally, Philly walked it off in the bottom of the 9th. Fantastic game, especially because the Mets took the two games after that šŸ˜‰

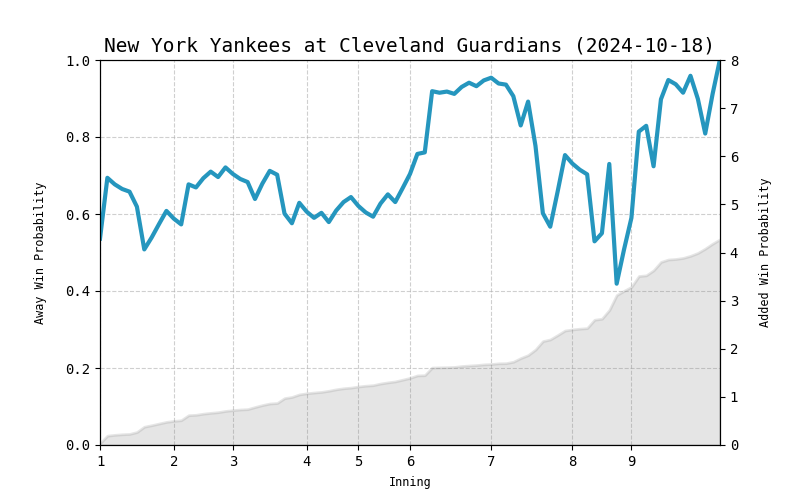
Another interesting thing about the postseason is that the second most interesting game according to BWRI is Game 4 of ALDS between Guardians and Yankees. You might think the third was better, and the truth is that it gets slightly more added WPA than the fourth, but BWRI likes how the pitchers were more dominant in the fourth with 24 K’s in total.

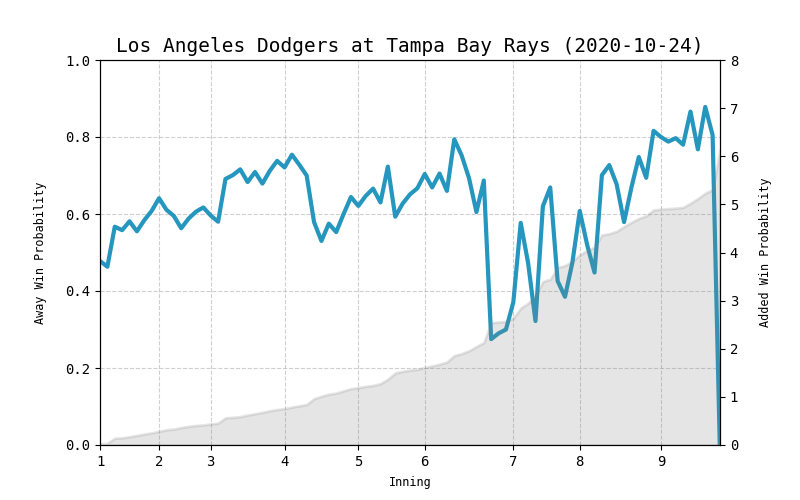
The most exciting postseason game since 2016 keeps being Game 4 of 2020 World Series, remember that crazy ending? Arozarena sliding slowly at home after that messy play, bottom of the 9th, two outs. That came after a set of back and forth late innings. Look at that graph:

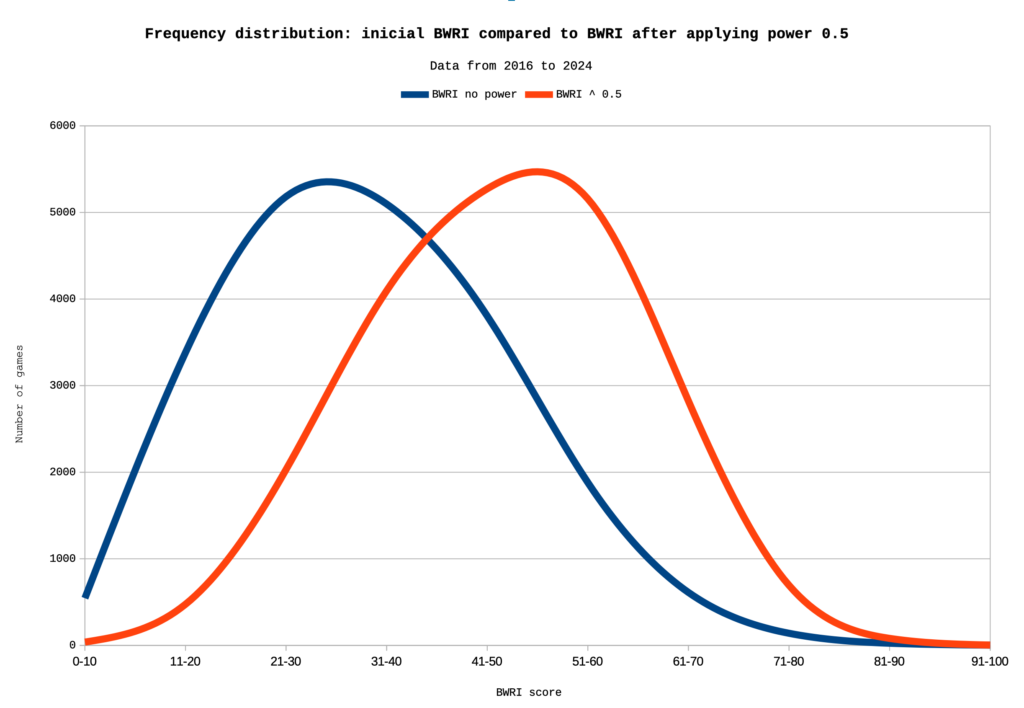
Finally, have in mind that BWRI scores grade from 0 to 100, but are not a percentile score. When I finished the math, I realized the distribution was very asymmetric, with most of the games having scores between 20 and 40, and very few of the achieving scores over 80. So I decided to apply a power 0.5 to the series, what makes the distribution more centered and increases the scores of the most exciting games.

Even though, in 9 seasons just 4 games achieved and score over 90, so have in mind that scores over 70 are rare, and even if you see a score over 60 you might be in front of a quite interesting game, maybe the most exciting in a common baseball week.

You can check every score on rewatchbaseballindex.com. Enjoy the offseason!

Introducing BWRI 2024: an index to choose a good baseball game to rewatch

Summary

I really enjoy rewatching games during the off season, so I set up an index that helps to choose which game to rewatch without knowing anything else than the teams and the day. Using Python and Savant data, I arranged an algorithm that takes account of changes in win probability during the game to make it possible to bring out exciting games to watch.

The code takes also account of good pitching, no-hitter situations, good defensive outfield plays and rivalry, to get a mix of different kinds of interesting games. BWRI rates from 0 to 100, but it’s no a percentile score. BWRI includes seasons from 2016. You can dig on BWRI in list mode if you want, but my suggestion is to use the random mode, filtering for games with a high score. BWRI doesn’t take account of season context, you can choose just postseason games to be shown, though.

Since 2024 season, the project moved from R Project and Retrosheet to Python and Savant. The reason is Retrosheet just updates play by play data at the end of the season, while using Savant updates can be made almost live.

Extended version

Offseasons are too long. I’m not much into the hot stove thing, so usually, I spend time watching games from the past season, eager to discover relievers or just having fun with exciting games. It’s not half the fun if you know in advance the outcome of the game, but this is not hard since there are more than 2,400 games in an MLB normal regular season. Sometimes I watch random games, but then I found baseballrewatch.com, and that saved me during the spring lockdown. Unfortunately, the website hasn’t been updated recently.

It was then that I thought if it would be possible to make an index to evaluate how much a game is worth to rewatch, just using the play by play stats of the game. Using Savant data and the knowledge I could easily get ready the basic tool to calculate the index: Win Probability Added (WPA) play by play, which is how the probability to win a game changes play after play. That’s the main tool used to create what I call Baseball Worth Rewatch Index (BWRI), there are other things I took into account though.

Total WPA

The first I thought was, If I add the absolute WPA values of every play in a game, the highest figures will point me to exciting games. Games that switched from the hands of one team to the other several times during the game. Drama, leverage situations, and entertainment, especially in the late innings, when a change in the scoreboard cashes a higher value of WPA. So the first factor of BWRI is Total WPA.

Pitching

It’s not all about runs and action, good pitching games are really enjoyable. Pitching here is evaluated in two simple ways. First, how many Ks per inning there are in a game, and how close it is to a no-hitter. So from games that get to the 7th with a no hitter to no-hitter games, all of those get extra points.

Good defensive outfield plays

Good defensive plays are really enjoyable too. I use catch probability data to reward games with good defensive plays, which here is basically games with 4,5 and 6 stars catches according to Savant.

Rivalry

Finally, I added some extra points for games with rivalry, for that purpose I use data from knowrivalry.com.

Other features

To get the final score, I normalize every feature of the index and give them a different weight according to the importance I decide they have, being added WPA and complete no-hitters the main factors.

Finally, to avoid extrainnings games to take over the whole top of the list, I decided to trim those games, 10 innings final score is multiplied, by 0.95, 11 by 0.9, and 12 inning games and more by 0.85.

To evaluate win probability play by play I used to employ the method suggested by Max Marchi, Jim Albert and Benjami S. Baumer in the Pproject days. Nowadays, I just use Savant data approach.

Thanks for reading. I hope you enjoy using BWRI and rewatching baseball. Don’t hesitate on leaving a comment or getting in touch for any comments or suggestions.

www.rewatchbaseballindex.com

The most exciting baseball games of 2022 (according to BWRI)

The 2022 update of Baseball Worth Rewatch Index is already available. Using Retrosheetā€™s play-by-play data the algorithm graded the most exciting games of the season according to parameters as unexpected outcome, total amount of winning probability added, pitching performance or rivalry. Let’s take a look at the top of the list. >>> “The most exciting baseball games of 2022 (according to BWRI)”

2021 MLB season games that deserve to be rewatched

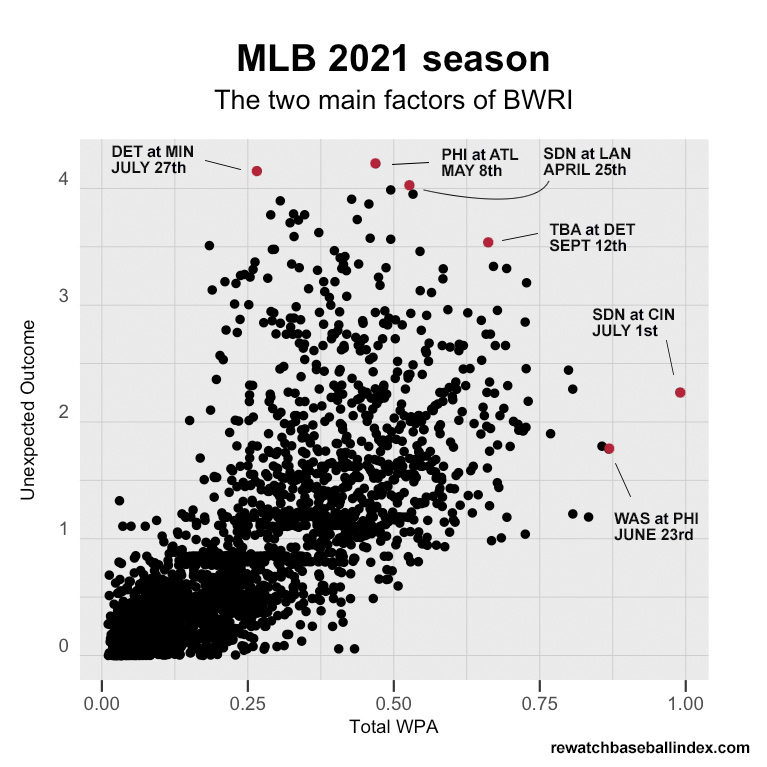
As soon as Retrosheet released the play-by-play datasets for the MLB 2021 season, I got to work on BWRI scores for the season. Let’s take a look at some of the most exciting games according to that rewatch index. I’ve made a graph combining the two main factors, but have in mind that BWRI also takes account of how close is a game, number of K’s, rivalry and no-hitters. >>> “2021 MLB season games that deserve to be rewatched”

Introducing BWRI: an index to choose a good baseball game to rewatch

Summary

I really enjoy rewatching games during the offseason, so I set up an index that helps to choose which game to rewatch without knowing anything else than the teams and the day. Using R, I arranged an algorithm that takes account of changes in win probability during the game to make it possible to bring out exciting games to watch.

>>> “Introducing BWRI: an index to choose a good baseball game to rewatch”

Autumn is not disappearing but has been moved on the calendar

Summer lasts longer. November, December, and January have more mild days than before

You’ve probably heard or chatted recently about the topic ā€œthe Autumn is disappearingā€. People talk about that here in Barcelona. After a mild October, suddenly a cold snap brought the winter for the first time. The feeling is that this is more and more common as years go by, but, is really the Fall threatened with extinction? Data rather suggest that it’s been pushed and it’s leaving the October. >>> “Autumn is not disappearing but has been moved on the calendar”

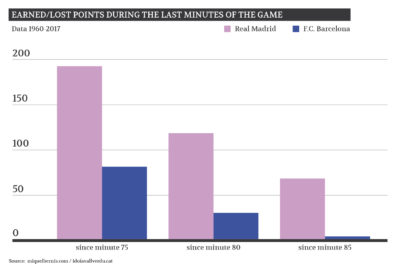
Five last minutes are a mine of points for Real Madrid

FC Barcelona would have won two more championships considering the games to end at minute 85

If you’re a BarƧa fan this should sound very familiar to you: it’s Sunday in the afternoon, you were at the movies. As you leave the theater and switch on the cell phone you get some messages about Real Madrid’s game. Real isn’t winning and there are just 20 minutes left. Don’t trust, but step into a bar to watch the rest of the game though. Let’s go, maybe there’s some good news on the way. 75 minutes and still a tie game, 80 minutes, 85 minutes, almost… but in the end Real Madrid scores, and you go home upset because of a game you were not supposed to have watched. Among the most common BarƧa supporters mantra’s, there is the one which says that Real Madrid scores last-gasp winners very often. What truth is there in this complaint?
>>> “Five last minutes are a mine of points for Real Madrid”

Why it’s best to bet for underdogs

The commission that bookmakers make you pay for betting it’s quite different depending on the chances of win

An easy search on the net is enough to find thousands of sources making reference to how bookmakers do to earn money, regardless of the outcomes in sports events. They do that in many different ways, but the most basic is simple to understand: they charge a kind of commission that it’s already included on the odds they offer you to win. >>> “Why it’s best to bet for underdogs”

The field factor and the refereeā€™s influence

The referees award almost the same fouls to home teams as to away ones, but away players are sent off more easily

Finished the previous post telling about one of my reference books here in this blog:Ā Scorecasting: The hidden influences behind how sports are played and games are won. One of the studies that the book mentions was made by two Spanish economists that in 2005 set out to see how peer pressure affects human decisions. Luis Garicano and Ignacio Palacios-Huerta counted the extra minutes added by referees in the Spanish league, taking into account the result of the score in the 90th minute. >>> “The field factor and the refereeā€™s influence”

Playing at home is no longer the advantage it used to be

A study of every match of the 5 most important European football leagues since 1970 up to nowadays. Overall, at the end of the 70ā€™s teams retained almost 70% of home points, whereas in the last seasons this figure has come down even below 60%

To start this blog site I get back an article I published on the newspaper ARA on august 2015. A study about the scores of the 5 main European football leagues, based on a database I made up using datasets from football-data.co.uk. I’ve split it into two halves. Here comes the first one: >>> “Playing at home is no longer the advantage it used to be”